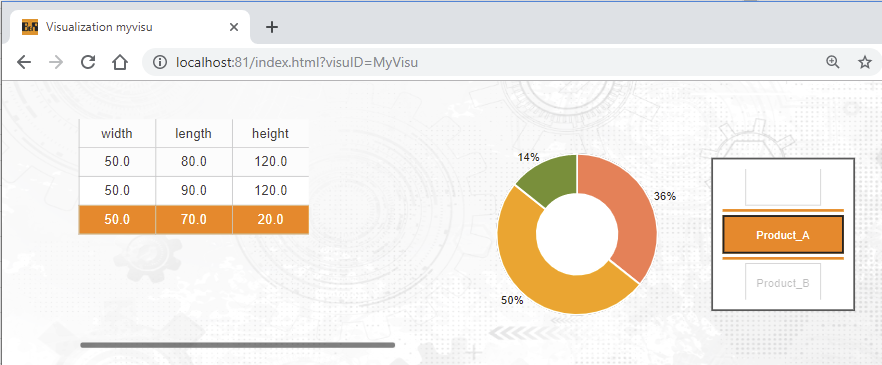
This section explains how data from the database can be displayed. The following widgets can be used:
•Widget "Table": Displays data in table form.
•Widget "LineChart": Displays data in a line diagram.
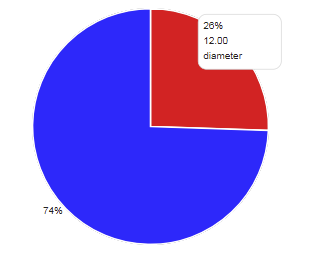
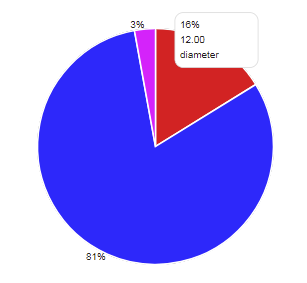
•Widget "PieChart", widget "DonutChart": Displays data in a pie chart.
•Widget "BarChart", widget "StackedBarChart": Displays data in a bar graph.
The following must be observed:
If a query is executed, the entire data of the query is only displayed in widget "Table" and widget "StackedBarChart".
If the data is only displayed graphically, only the data of the query is displayed that would display the first line in widget "Table".
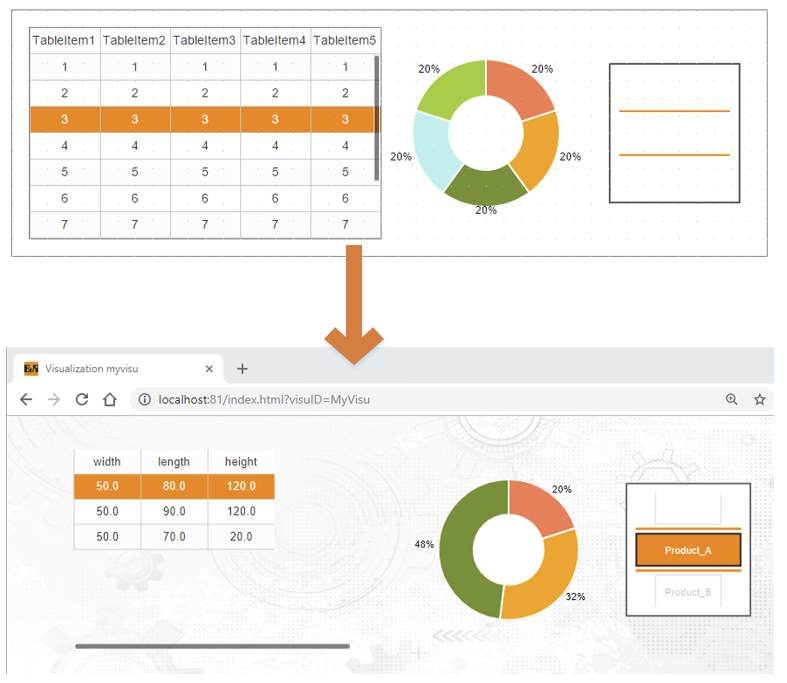
If widget "Table" is used in combination with a chart widget, the graphical view always displays the data selected in the table. Excluded from this is widget "StackedBarChart" since this can display the entire data of the query.
Executing a query:
In order for the widgets above to display information from the database, a query must be executed. For more information, see section Working with widget "Database".
Configuring the widgets:
Depending on how many columns the desired query contains, a corresponding number of items must be specified in the widget. If several queries are available, the number of items must be as large as the query that provides the most information. For example, if there are 3 queries:
Query1: Returns information from 2 columns in the database table.
Query2: Returns information from 5 columns in the database table.
Query3: Returns information from 3 columns in the database table.
In this case, the maximum number of items in the widget is 5. This means 5 columns must be specified in widget "Table", or 5 graphs used in widget "LineChart (widget "LineChartGraph"), etc.
If more items are configured than the query returns, the remaining items are not displayed in the widget. If a query only returns information from 3 columns but 5 items are configured, 2 items are not displayed.
The chart widgets can only display numeric information. If the executed query contains a text (STRING), it will not be displayed in the diagram. The text can only be displayed via the table.
The visibility of items can be influenced by the following factors:
•By selecting a query with fewer or more returned items.
The query always specifies how many items are displayed during a query update.
•By changing the visible property after executing query "SELECT".
If an item is set to visible=false before the query, this setting is overwritten by the new query.
Displaying data in table format
Widget "Table" is used for display as a table. This must be placed inside widget "Database":
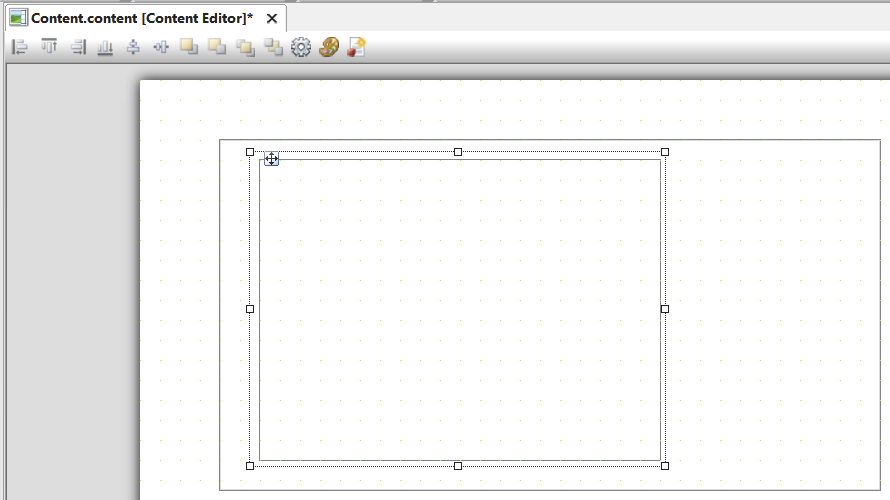
Numerical values and texts can be displayed. Images or date/time information cannot be displayed. This means that only widget "TableItem" can be used to specify the columns. No variables must be bound. Widget "Database" fills widget "Table" automatically.
Only one "Table" widget can be added to widget "Database".
Displaying data in a line diagram
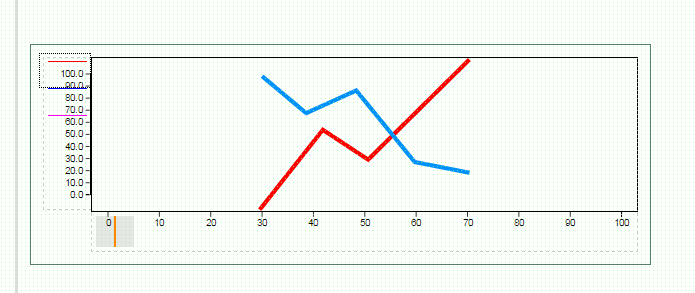
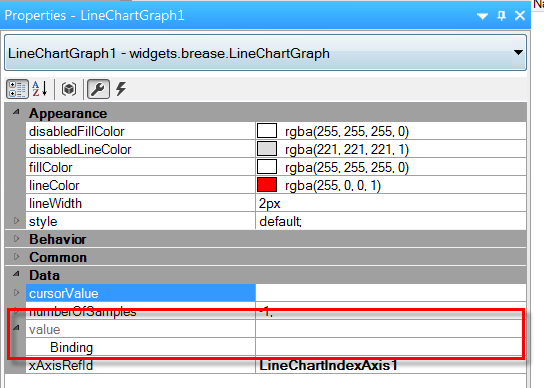
To display data in a line diagram, widget "LineChart" is added to widget "Database" and then configured. For more information, see "LineChart" concept. As many "LineChartGraph" widgets are added as needed.
There can only be one "LineChart" widget in widget "Database".
No variables must be bound. Widget "Database" populates widget "LineChart" automatically.
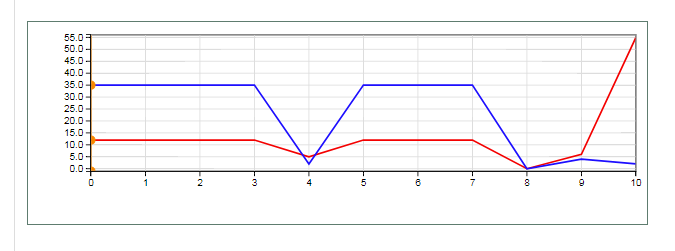
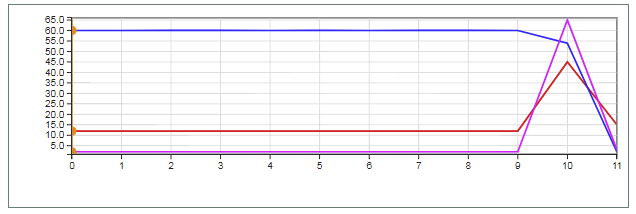
Setting different colors can help improve differentiation in widget "LineChart".
|
|
Shown in the browser here are two different queries:
|
|
Displaying data in a bar graph
Widget "BarChart" or widget "StackedBarChart" can be used to display numeric data in a bar graph.
Widget "StackedBarChart":
Widget "StackedBarChart" must be configured column by column as well as row by row.
First, widget "StackedBarChart" is added to widget "Database". After that, as many "StackedBarChartItem" widgets are added as are needed for the query.
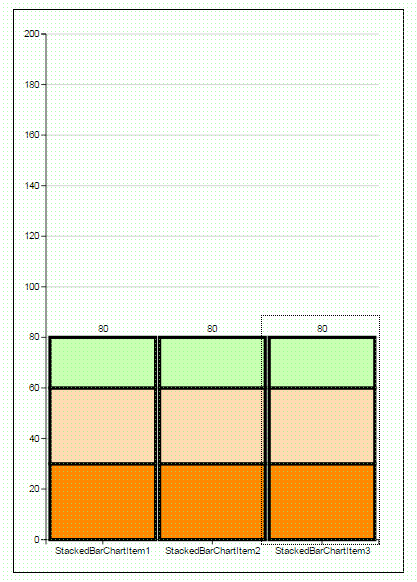
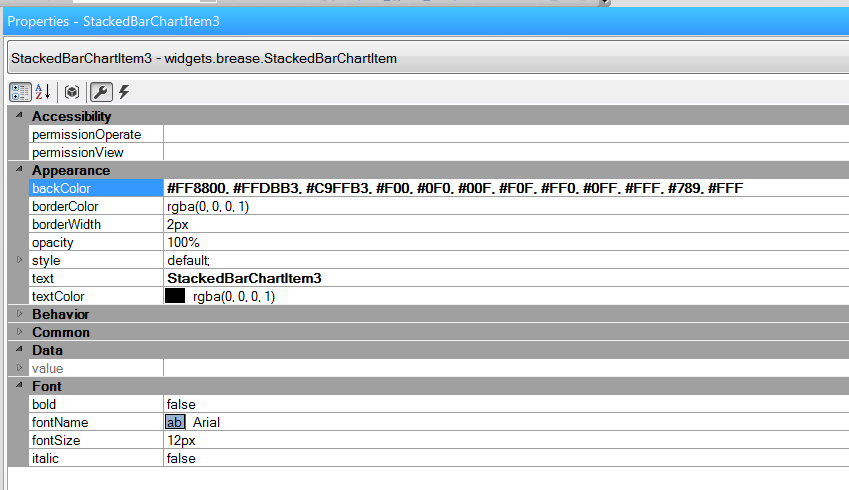
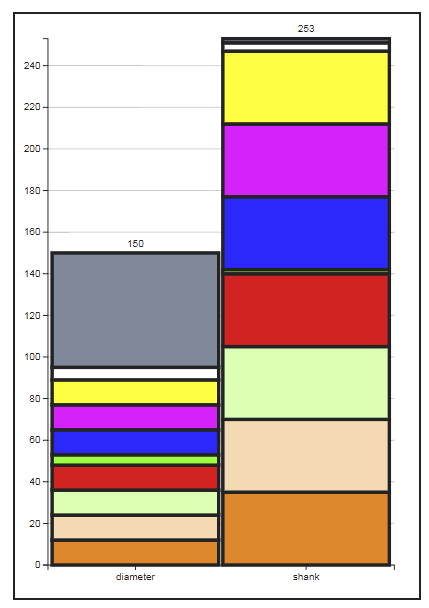
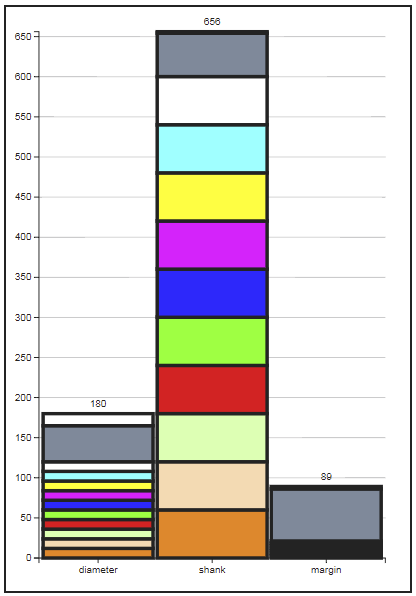
Afterwards, the colors inside widget "StackedBarChartItem" must be defined. In the example below, 11 lines are displayed, i.e. an array with 11 colors is defined on property backColor . If there are more lines than colors, they are set to black by default.
There can only be one "StackedBarChart" widget in widget "Database".
No variables must be bound. Widget "Database" populates widget "StackedBarChart" automatically.
Widget "StackedBarChart" displays the entire data of the query.
Fig.: Query 1 |
Fig.: Query 2 |
Shown in the browser here are two different queries:
Fig.: Query 1 |
Fig.: Query 2 |
Widget "BarChart"
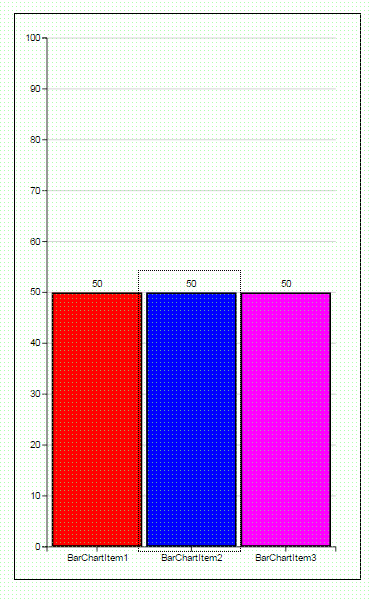
Widget "BarChart" is added to widget "Database". As many "BarChartItem" widgets are added as are needed for the query.
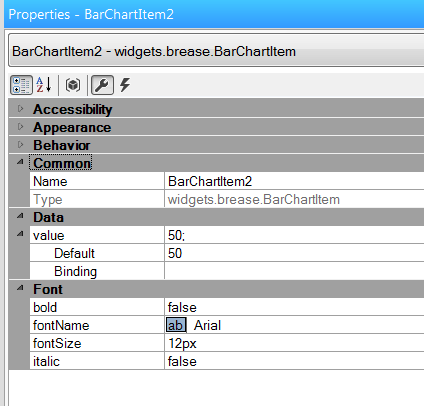
To better distinguish the data, the color of the respective "BarChartItem" widgets should be adapted. No variables must be bound. Widget "Database" populates widget "BarChart" automatically.
There can only be one "BarChart" widget in widget "Database".
|
|
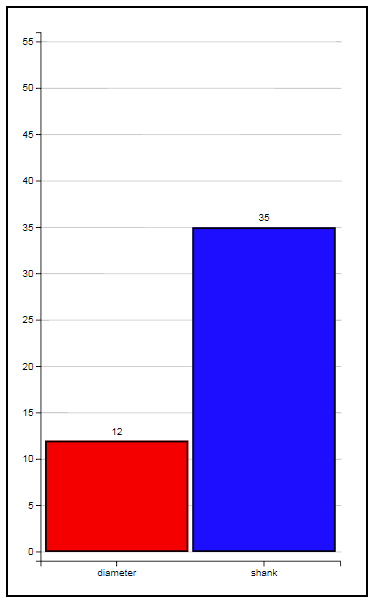
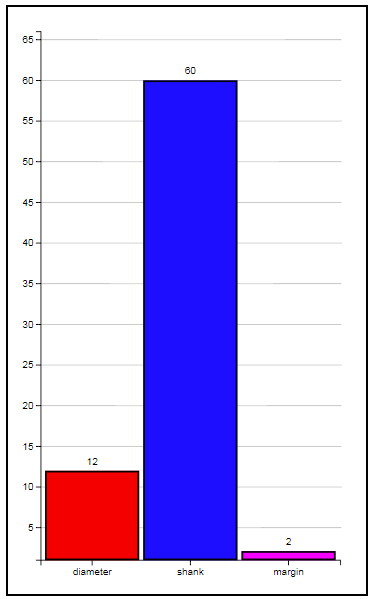
Shown in the browser here are two different queries:
Fig.: Query 1 |
Fig.: Query 2 |
Displaying data in a pie chart
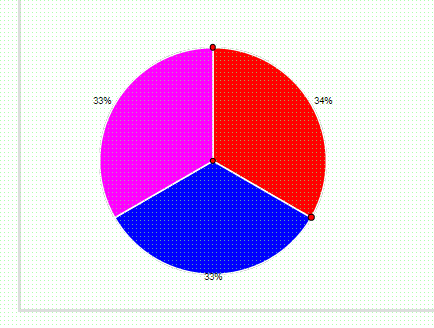
Data can be displayed as a pie chart using widget "PieChart" or widget "DonutChart".
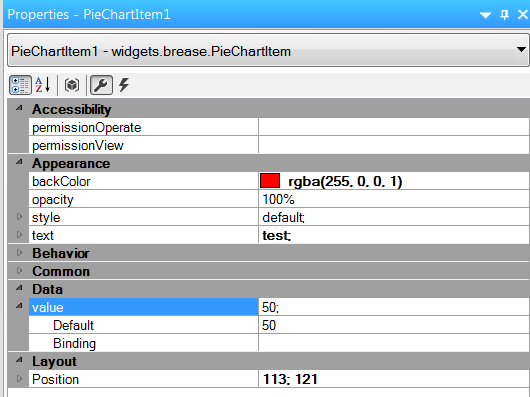
The desired widget is added to widget "Database". As many "PieChartItem" widgets or "DonutChartItem" widgets are added as are needed for the query.
No variables must be bound. Widget "Database" populates the widget automatically.
To better distinguish the data, the color of each item widget should be adapted.
|
|
Table: Editor
Shown in the browser here are two different queries:
Fig.: Query 1 |
Fig.: Query 2 |
