This section includes detailed explanations for the concept of line chart widgets.
Basic information
LineChart widgets can be used to display numerical data in a diagram. The numerical values are bound in the form in an array.
The diagram is put together from the available LineChart widgets depending on the use case. Multiple x- and y-axes can be placed in one LineChart widget. Multiple suitable Cursor widgets can be placed in each x-axis; multiple graphs can be placed in each y-axis.
The data to be displayed by LineChart must be bound to the respective LineChartGraph widget using property value. Widget LineChartGraph additionally requires the name of the associated x-axis in property xAxisRefId.
Available widgets
•LineChart: This widget provides a container for all other required widgets. The full size of the diagram is defined using this widget.
•LineChartIndexAxis: This widget is added to widget "LineChart" in order to display an x-axis whose range of values consists of sequential index values.
•LineChartTimeAxis: This widget is added to widget "LineChart" in order to display an x-axis whose range of values consists of sequential time values.
•LineChartXAxisIndexCursor: This widget can only be placed on widget "LineChartIndexAxis". At runtime, it creates a vertical line that shows the intersection of an x-value with the associated LineChartGraph (y-value).
•LineChartXAxisMsTimeCursor: This widget can only be placed on widget "LineChartTimeAxis". At runtime, it creates a vertical line that shows the intersection of an x-value with the associated LineChartGraph (y-value). Unlike widget "LineChartXAxisTimeCursor", a resolution down to 1 millisecond is possible here.
•LineChartXAxisTimeCursor: This widget can only be placed on widget "LineChartTimeAxis". At runtime, it creates a vertical line that shows the intersection of an x-value with the associated LineChartGraph (y-value).
•LineChartYAxis: This widget is added to widget "LineChart" to display a y-axis whose range of values comprises the y-values to be displayed.
•LineChartGraph: This widget can only be placed on widget "LineChartYAxis". At runtime, it displays the graph of the diagram that represents the bound y-values.
Example configuration
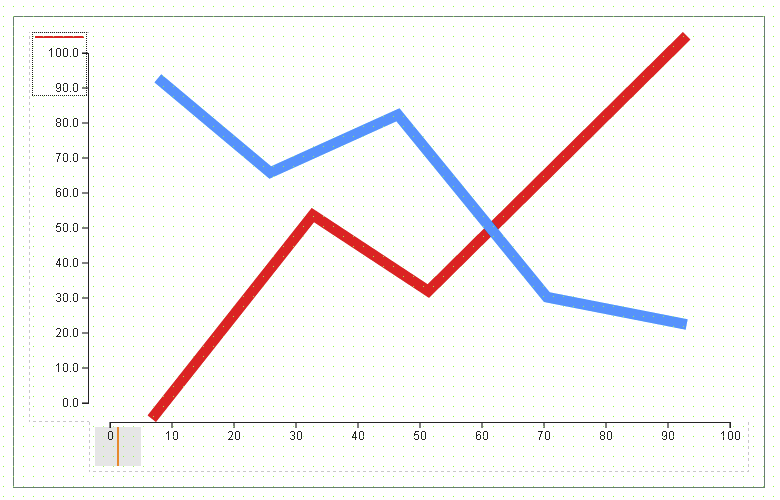
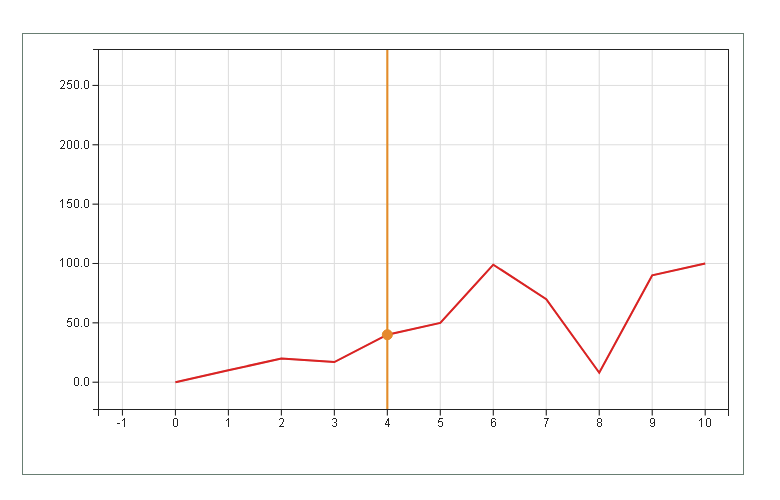
The following shows a diagram created in the editor using line chart widgets. The diagram uses LineChartIndexAxis in combination with LineChartXAxisIndexCursor and LineChartYAxis in combination with LineChartGraph.
Step 1:
Select widget "LineChart" from the Widget Catalog and place it in the piece of content.
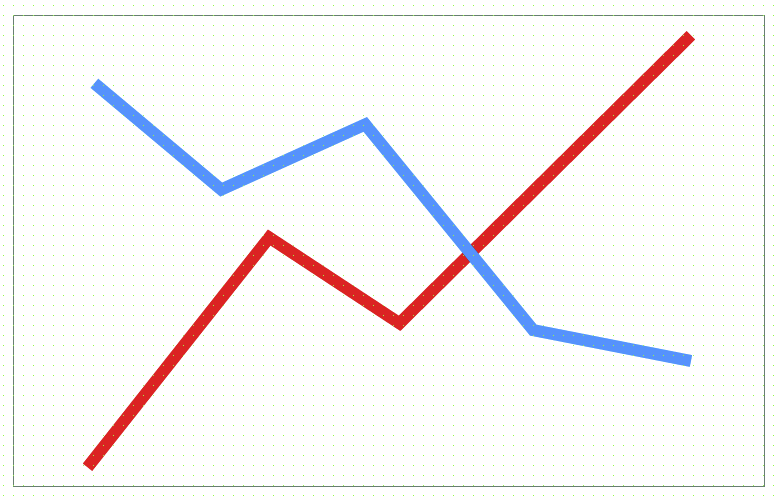
Step 2:
Select widget "LineChartIndexAxis" and place it on widget "LineChart".
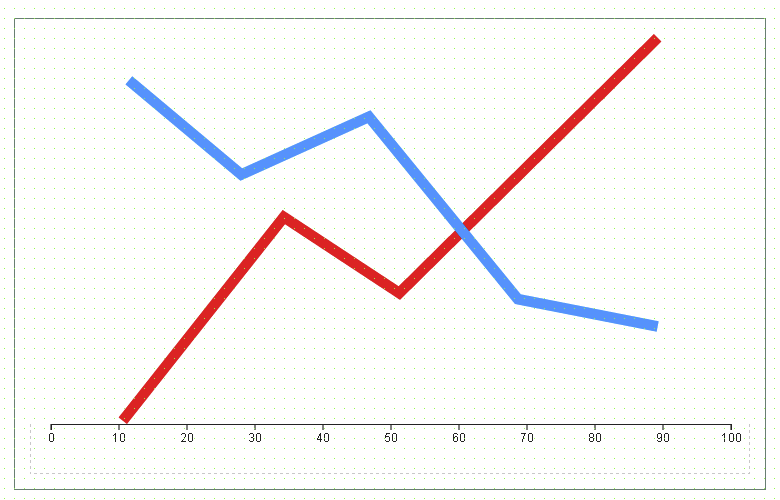
Step 3:
Select widget "LineChartYAxis" and place it on widget "LineChart".
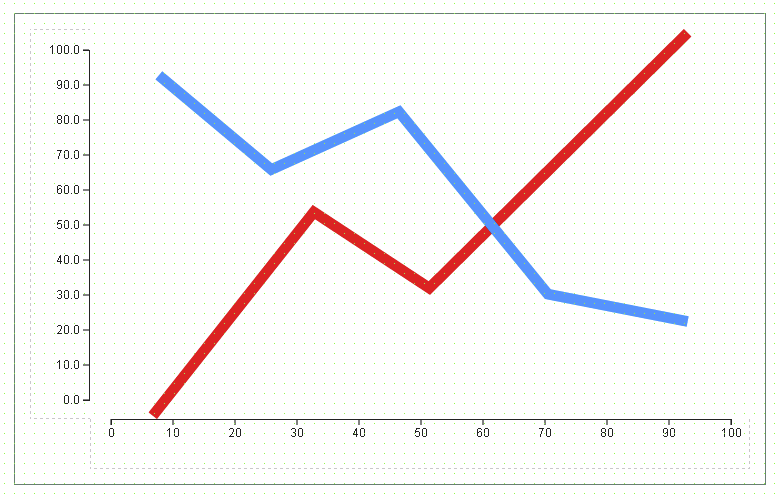
Step 4:
Select widget "LineChartXAxisIndexCursor" and place it on the x-axis.
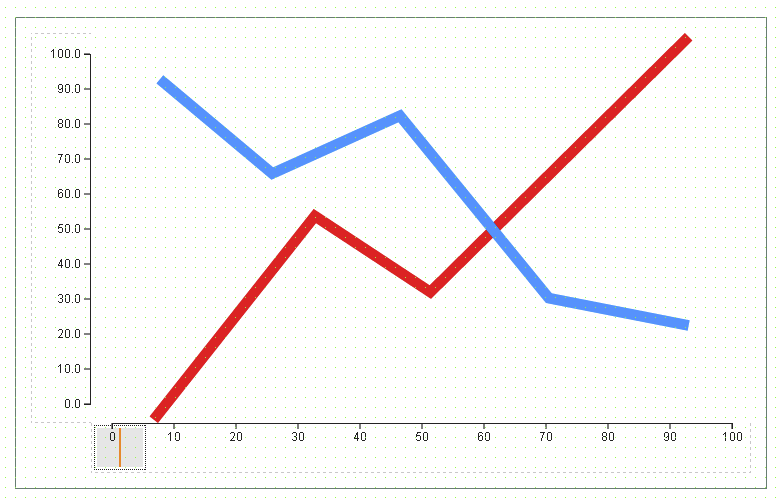
Step 5:
Select widget "LineChartGraph" and place it on the y-axis.
Step 6:
Select the placed LineChartGraph widget. Set property xAxisRefId as the value for the name of widget "LineChartIndexAxis". Set property value as the value for the binding to a variable (numeric array).

Step 7:
Compile and transfer the project. If the configuration is successful, LineChart will appear as follows at runtime.
Explanation of the differences and behavior of LineChartXAxisTimeCursor and LineChartXAxisMsTimeCursor
The following sections explains the behavior and differences between these two widgets. To improve readability, widget "LineChartXAxisTimeCursor" will be referred to as "TimeCursor"; widget "LineChartXAxisMsTimeCursor" will be referred to as "MsTimeCursor".
Widget "LineChartTimeAxis" can uniformly display sampled data with a resolution of 1 ms. This means if a time span of 1 s has been defined for the axis, then the data set being displayed can contain up to 1001 values (samples).
The main difference between "TimeCursor" and "MsTimeCursor" is the interface and how widget property value is interpreted:
•TimeCursor:
•Data type of property value: DateTime (resolution down to 1 s).
•value represents an absolute position on widget "LineChartTimeAxis".
•MsTimeCursor:
•Data type of property value: Time (resolution down to 1 ms).
•value represents a relative position measured from the minimum value of widget "LineChartTimeAxis".
Explanation of the differences with example:
The minimum value of widget "LineChartTimeAxis" is set to DT#2107-02-06-06:30:30; here there is a point for date 2107-02-06 and time 06 hours, 30 minutes, 35 seconds and 352 milliseconds. If "TimeCursor" as well as "MsTimeCursor" placed at this point of the axis, property "value" receives the following values for each:
•TimeCursor: DT#2017-02-06-06:30:35
•MsTimeCursor: T#5s352ms
Since the time value of "MsTimeCursor" is relative to the minimum value of "LineChartTimeAxis", a value less than 0 is not possible. Likewise, data type "Time" being used has an upper limit of 24 days, 20 hours, 31 minutes, 23 seconds and 647 milliseconds. This results in a maximum range of values that can be assigned to property value of "MsTimeCursor":
•Minimum value of property value: T#0ms
•Maximum value of property value: T#24d20h31m23s647ms
Explanation of the behavior with example:
Premise 1:
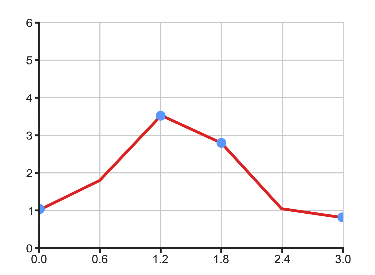
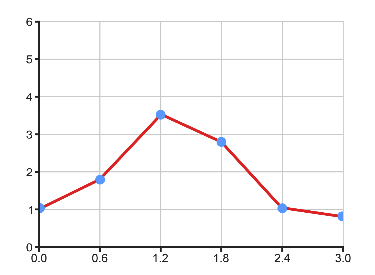
A data set with a sampling rate of 600 ms is bound; the time span configured on "LineChartTimeAxis" is 3 seconds. This means that 6 values exist in the data set that are placed on the axis at the following positions: 0.0 s, 0.6 s, 1.2 s, 1.8 s, 2.4 and 3.0 s.
Behavior of TimeCursor:
Due to the maximum resolution of this cursor of 1 second, the movement of this widget is limited to steps of 1 second. If one of these steps is not available as a point along the axis, then the cursor will use the nearest available point. If property "value" of the cursor is set to 1, the cursor will move along the axis to 1.2 since 1 is not available as a point. If "value" = 2, the cursor will move to 1.8.
Behavior of MsTimeCursor:
Since both "MsTimeCursor" as well as "LineChartTimeAxis" have a resolution of 1 ms, "MsTimeCursor" can use any points available on the axis (that are defined by the data set). In the scenario above, for example, "MsTimeCursor" can use any of the points along the axis made available by the data set.
Premise 2:
Now the sampling rate is 1.2 seconds, and the time span configured on the axis is 6 seconds. Available points along the axis: 0.0 s, 1.2 s, 2.4 s, 3.6 s, 4.8 s, 6.0 s.
Behavior of TimeCursor:
For the behavior of "TimeCursor", see the following table.
Input via property value |
Assigned point on axis |
Value returned to property "value" |
0 |
0 |
Unchanged |
1 |
1.2 |
Unchanged |
2 |
2.4 |
Unchanged |
3 |
3.6 |
4 |
4 |
3.6 |
Unchanged |
5 |
4.8 |
Unchanged |
6 |
6 |
Unchanged |
Since "TimeCursor" always uses the nearest available point on the axis, entering value 3 will result in output of value 4 (since point 3.6 is rounded to value 4 at a maximum resolution of 1 second).
Behavior of MsTimeCursor:
"MsTimeCursor" behaves as in premise 1; any available point on the axis can be used.
Actions ZoomIn and ZoomOut
The following applies to the zoom actions: The current zoom factor is divided or multiplied by the fixed scaling factor 1.2.
If action ZoomIn action is triggered twice and action ZoomOut is triggered twice in a row, for example, it will result in the following zoom factor:
Current zoom factor = 1
1st ZoomIn action → Current zoom factor = Current zoom factor * 1.2 = 1 * 1.2 = 1.2
2nd ZoomIn action → Current zoom factor = Current zoom factor * 1.2 = 1.2 * 1.2 = 1.44
1st ZoomOut action → Current zoom factor = Current zoom factor / 1.2 = 1.44 / 1.2 = 1.2
2nd ZoomOut action → Current zoom factor = Current zoom factor / 1.2 = 1.2 / 1.2 = 1