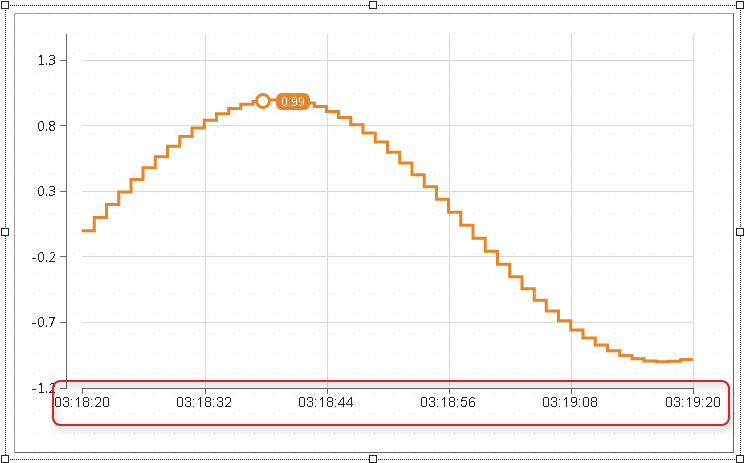
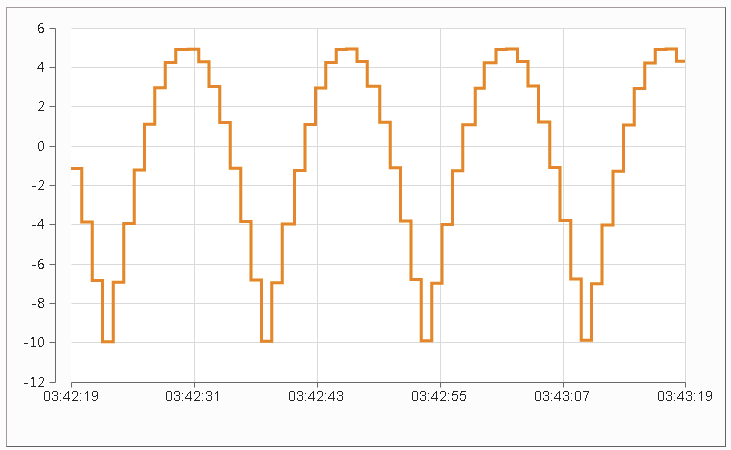
The XAxis collection defines the x-axis of the OnlineChartHDA graph.
Appearance
|
|
Editor |
Web browser |
Properties
Type |
Description |
Bindable |
Necessary |
Default value |
|
Defines the number of subdivisions. The initial value is not included. |
|
|
5 |
||
position |
Defines whether the x-axis is positioned at the bottom or top of the graph. |
|
|
bottom |
|
Reference to a customizable widget style. |
|
|
default |
||
Defines the format used to display the date and/or time. It is possible to specify a format string (e.g. "HH:mm:ss") or predefined pattern (e.g. "F"). |
|
|
hh:mm:ss |
||
Defines the time span the axis is visible in seconds. If timeSpan receives a value less than 1, the x-axis automatically changes its time span to 1 s. |
|
|
60 |
||
Defines the visibility of the widget. The widget can be hidden with visible=false. (visible = true, hidden = false). The "visible" behavior is inherited from the container widget to the child widgets. |
|
|
true |
Styleable properties
Type |
Description |
Default value |
|
gridColor |
Defines the color used to display the graph grid. |
#DBDBDB |
|
color |
Defines the color used to display the y-axis and ticks of the widget. |
#000000 |
|
textColor |
Defines the color used to display the x-axis texts. |
#000000 |
|
disabledTextColor |
Defines the color used to x-axis texts in the disabled state. |
#808080 |
|
fontName |
Defines the font used to display x-axis texts. |
Arial |
|
fontSize |
Defines the size used to display the x-axis texts. |
12px |
|
tickLabelRotation |
Defines the rotation of the x-axis texts, e.g. a value of 90 degrees changes the rotation of the widget by 90 degrees clockwise. |
0deg |

