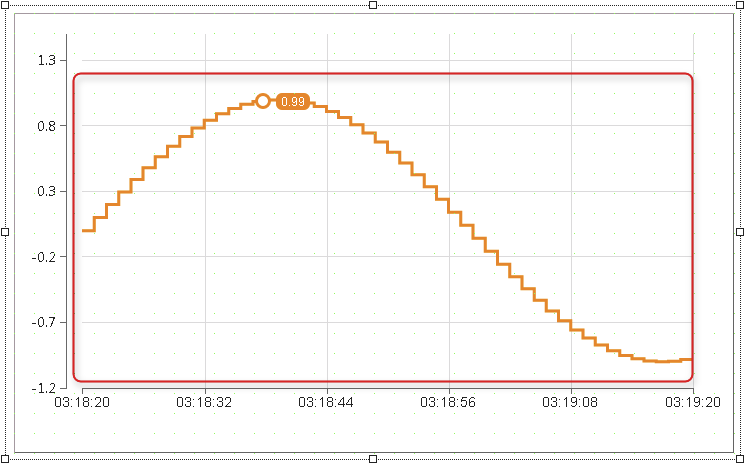
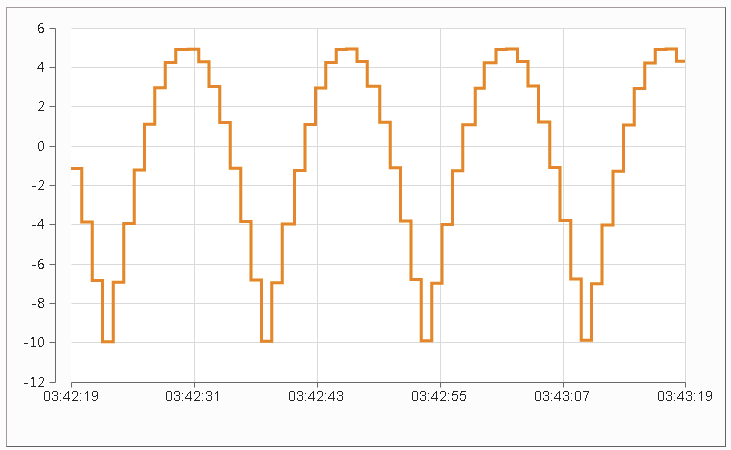
The graph collection defines the data to be displayed in widget "OnlineChartHDA".
A maximum of 8 graphs can be used in one graph.
Appearance
|
|
Editor |
Web browser |
Properties
Type |
Description |
Bindable |
Necessary |
Default value |
|
Defines the current value with the unit where the cursor intersects the graph. If there is no data point in front of the cursor or the cursor is not active, the property is set to "null". A binding on widget "NumericOutput", for example, displays "XX" if the cursor intersection point does not receive a valid value. |
|
|
|
||
Defines the current value where the cursor intersects the graph. If there is no data point in front of the cursor or the cursor is not active, the property is set to "null". A binding on widget "NumericOutput", for example, displays "XX" if the cursor intersection point does not receive a valid value. |
|
|
0 |
||
Defines the data source of the graph. It is possible to bind to a numerical value with a unit. |
|
|
|
||
Defines the data source of the graph. |
|
|
0 |
||
Reference to a customizable widget style. |
|
|
default |
||
type |
Defines how the data points are connected to a line. See the data type for possibilities. |
|
|
stepLine |
|
Defines the visibility of the widget. The widget can be hidden with visible=false. (visible = true, hidden = false). The "visible" behavior is inherited from the container widget to the child widgets. |
|
|
true |
||
Specifies the reference of the y-axis that must be assigned to this graph. The y-axis collection defines the display unit and the scaling of the graph. |
|
|
|

