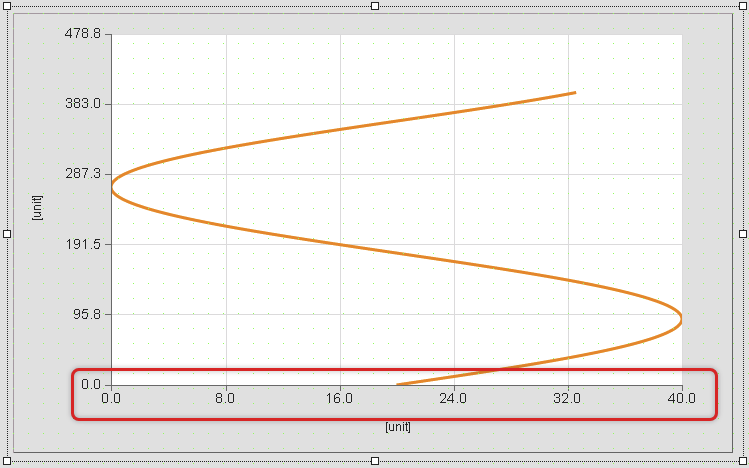
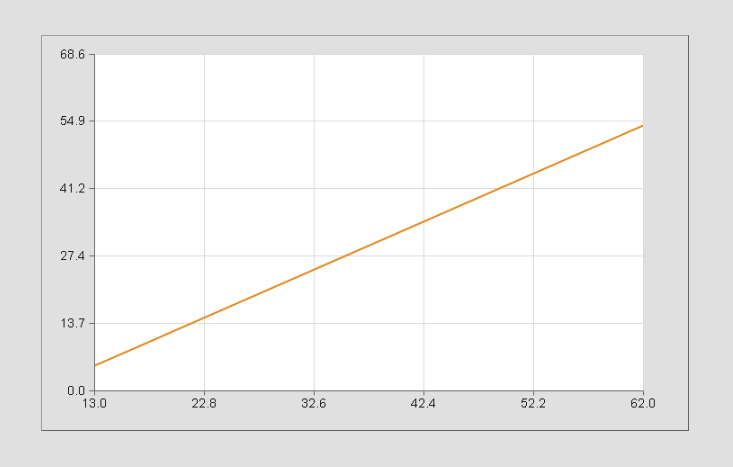
The x-axis collection defines the x-axis of the XYChart graph.
A maximum of 8 x-axes can be used in one graph.
Appearance
|
|
Editor |
Web browser |
Properties
Type |
Description |
Bindable |
Necessary |
Default value |
|
Defines the number of subdivisions. The initial value is not included. |
|
|
5 |
||
position |
Defines whether the x-axis is positioned at the bottom or top of the graph. |
|
|
bottom |
|
Reference to a customizable widget style. |
|
|
default |
||
Defines the unit code of the widget. |
|
|
|
||
Defines the format in which the data is displayed. |
|
|
{'metric':{ 'decimalPlaces' : 1, 'minimumInteger-Digits' : 1 }, 'imperial' :{ 'decimal-Places' : 1, 'minimumIntegerDigi-ts' : 1 }, 'imperial-us' :{ 'decimal-Places' : 1, 'minimumIntegerDigits' : 1 }} |
||
Defines the maximum range if rangeMode is set to "fromConfiguration". This value has no unit and is not converted. |
|
|
|
||
Defines the minimum range if rangeMode is set to "fromConfiguration". This value has no unit and is not converted. |
|
|
|
||
rangeMode |
Defines which minimum and maximum values are used for the y-axis. If rangeMode "fromConfiguration" is used, the range is static and not converted. |
|
|
autoscale |
|
showUnit |
Defines whether the unit should be displayed. A node binding is necessary for this. |
|
|
true |
|
title |
Defines the title of the x-axis. A static text or text from the text system can be used. |
|
|
|
|
Defines the visibility of the widget. The widget can be hidden with visible=false. (visible = true, hidden = false). The "visible" behavior is inherited from the container widget to the child widgets. |
|
|
true |
Styleable properties
Type |
Description |
Default value |
|
gridColor |
Defines the color used to display the graph grid. |
#DBDBDB |
|
color |
Defines the color used to display the y-axis and ticks of the widget. |
#000000 |
|
textColor |
Defines the color used to display the x-axis texts. |
#000000 |
|
disabledTextColor |
Defines the color used to display the x-axis texts in the disabled state. |
#808080 |
|
fontName |
Defines the font used to display x-axis texts. |
Arial |
|
fontSize |
Defines the size used to display the x-axis texts. |
12px |
|
titleTextColor |
Defines the color used to display the x-axis title. |
#000000 |
|
titleFontSize |
Defines the size of the font used to display the x-axis title. |
12px |
|
titleFontName |
Defines the font used to display the x-axis title. |
Arial |
|
tickLabelRotation |
Defines the rotation of the x-axis texts, e.g. a value of 90 degrees changes the rotation of the widget by 90 degrees clockwise. |
0deg |

