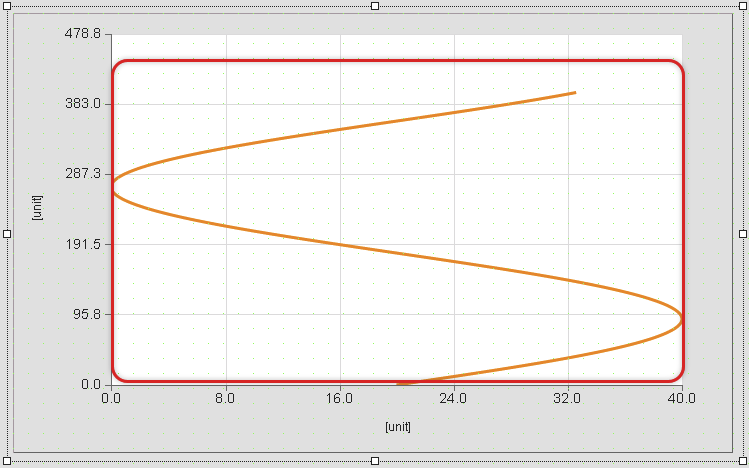
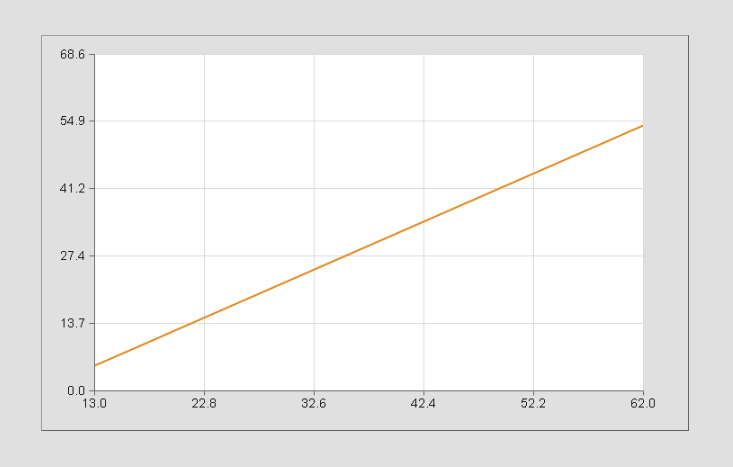
The graph collection defines the data to be displayed in widget XYChart.
A maximum of 16 graphs can be used in one graph.
Appearance
|
|
Editor |
Web browser |
Properties
Type |
Description |
Bindable |
Necessary |
Default value |
|
Defines the current value with the unit at which the first cursor intersects the graph on the x-axis. If there is no data point in front of the cursor or the cursor is not active, the property is set to "null". A binding on widget NumericOutput, for example, displays "XX" if the cursor intersection point does not receive a valid value. |
|
|
|
||
Defines the current value at which the first cursor intersects the graph on the x-axis. If there is no data point in front of the cursor or the cursor is not active, the property is set to "null". A binding on widget NumericOutput, for example, displays "XX" if the cursor intersection point does not receive a valid value. |
|
|
0 |
||
Defines the current value with the unit at which the first cursor intersects the graph on the y-axis. If there is no data point in front of the cursor or the cursor is not active, the property is set to "null". A binding on widget NumericOutput, for example, displays "XX" if the cursor intersection point does not receive a valid value. |
|
|
|
||
Defines the current value at which the first cursor intersects the graph on the y-axis. If there is no data point in front of the cursor or the cursor is not active, the property is set to "null". A binding on widget NumericOutput, for example, displays "XX" if the cursor intersection point does not receive a valid value. |
|
|
0 |
||
Defines the current value with the unit at which the second cursor intersects the graph on the x-axis. If there is no data point in front of the cursor or the cursor is not active, the property is set to "null". A binding on widget NumericOutput, for example, displays "XX" if the cursor intersection point does not receive a valid value. |
|
|
|
||
Defines the current value at which the second cursor intersects the graph on the x-axis. If there is no data point in front of the cursor or the cursor is not active, the property is set to "null". A binding on widget NumericOutput, for example, displays "XX" if the cursor intersection point does not receive a valid value. |
|
|
0 |
||
Defines the current value with the unit at which the second cursor intersects the graph on the y-axis. If there is no data point in front of the cursor or the cursor is not active, the property is set to "null". A binding on widget NumericOutput, for example, displays "XX" if the cursor intersection point does not receive a valid value. |
|
|
|
||
Defines the current value at which the second cursor intersects the graph on the y-axis. If there is no data point in front of the cursor or the cursor is not active, the property is set to "null". A binding on widget NumericOutput, for example, displays "XX" if the cursor intersection point does not receive a valid value. |
|
|
0 |
||
Defines the data source of the x-values. It is possible to bind to a numerical array with a unit. |
|
|
|
||
Defines the data source of the x-values. |
|
|
|
||
Defines the data source of the y-values. It is possible to bind to a numerical array with a unit. |
|
|
|
||
Defines the data source of the y-values. |
|
|
|
||
Reference to a customizable widget style. |
|
|
default |
||
Defines the visibility of the widget. The widget can be hidden with visible=false. (visible = true, hidden = false). The "visible" behavior is inherited from the container widget to the child widgets. |
|
|
true |
||
Specifies the reference of the x-axis that must be assigned to this graph. The display unit and the scaling of the graph are defined on the x-axis collection. |
|
|
xAxis1 |
||
Specifies the reference of the y-axis that must be assigned to this graph. The y-axis collection defines the display unit and the scaling of the graph. |
|
|
yAxis1 |
||
Defines the number of values that should be drawn (highest element of the bound x-/y-array starting with [0]). A value of -1 draws all data from the bound x-/y-array. |
|
|
-1 |

