Widget "OnlineChart" is used to display current process values on a graph.
|
Several tutorials about this topic can be found on our YouTube channel. |
|
For this widget, there is a use case that explains how the widget can be used. |
|
Our B&R Tutorial Portal includes a tutorial on widget OnlineChart (GER/ENG). (access data) |
Name |
Description |
|
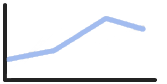
OnlineChart |
Widget "OnlineChart" is a container for displaying current process values in a graph. |
|
OnlineChartGraph |
Widget "OnlineChartGraph" represents the binding for the data to be displayed. |
|
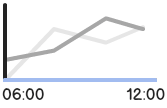
OnlineChartTimeAxis |
Widget "OnlineChartTimeAxis" provides an x-axis for widget "OnlineChart". |
|
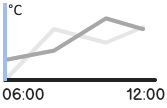
OnlineChartYAxis |
Widget "OnlineChartYAxis" defines the y-axis of the graph. This widget contains additional widgets for data binding. |