This section includes detailed explanations for the concept of online chart widgets.
Basic information
OnlineChart widgets can be used to display numerical data in a diagram. In contrast to widget "LineChart", which displays an already recorded array of numerical values, the graph for widget "OnlineChart" is drawn based on the changing values of a single numeric variable over time.
The diagram is put together from the available OnlineChart widgets. Multiple y-axes can be placed in one OnlineChart widget. Multiple graphs can be placed in each y-axis.
The data to be displayed by "OnlineChart" must be bound to the respective "OnlineChartGraph" widget using property value. Widget "OnlineChartGraph" additionally requires the name of the associated x-axis in property xAxisRefId.
Available widgets
•OnlineChart: This widget provides a container for all other required widgets. The full size of the diagram is defined using this widget.
•OnlineChartTimeAxis: This widget is added to widget "OnlineChart" in order to display an x-axis whose range of values consists of sequential time values.
•OnlineChartYAxis: This widget is added to widget "OnlineChart" to display a y-axis whose range of values comprises the y-values to be displayed.
•OnlineChartGraph: This widget can only be placed on widget "OnlineChartYAxis". At runtime, it displays the graph of the diagram that represents the bound y-value.
Behavior when changing pages
Widget OnlineChart draws the graph based on the value of a single variable. Recording of the variable value is different depending on whether content caching is enabled.
Behavior if content caching disabled:
When navigating from a page with an active online chart to another page and back again, the online chart displays the graph beginning with the currently valid value of the bound variable at this point in time. Values recorded before the page change are no longer shown.
Behavior if content caching enabled:
When navigating from a page with an active online chart to another page and back again, the online chart resumes displays the graph with the currently valid value of the bound variable at this point in time. Values recorded before the page change continue to be shown. Changes to the variable's value that take place while the page with the online chart is not shown will not be recorded since the binding between the variable and widget is not active during this time. Instead, the widget draws the graph during this time by continuing with the last valid value before the page change.
Example configuration
The following shows a diagram created in the editor using inline chart widgets. The diagram uses OnlineChartTimeAxis and OnlineChartYAxis in combination with OnlineChartGraph.
Step 1:
Select widget "OnlineChart" from the Widget Catalog and place it in the piece of content.
Step 2:
Select widget "OnlineChartTimeAxis" and place it on widget "OnlineChart".
Step 3:
Select widget "OnlineChartYAxis" and place it on widget "OnlineChart".
Step 4:
Select widget "OnlineChartGraph" and place it on the y-axis.

Step 5:
Select the placed OnlineChartGraph widget. Set property xAxisRefId as the value for the name of widget "OnlineChartTimeAxis". Set property value as the value for the binding to a variable.
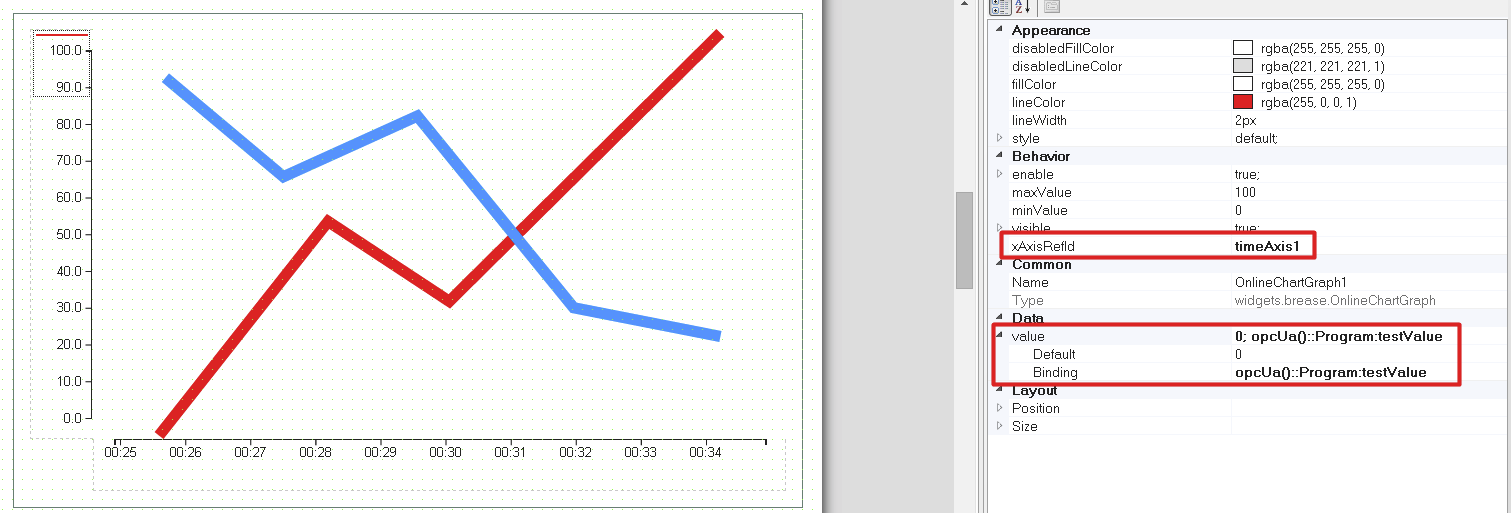
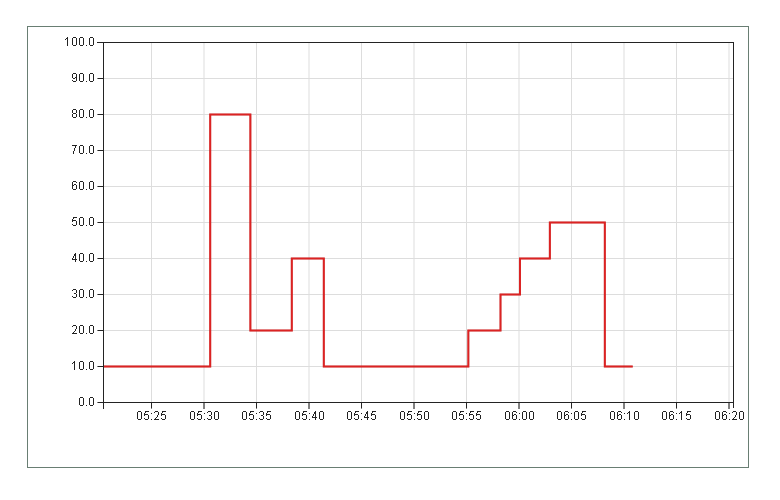
Step 6:
Compile and transfer the project. If the configuration is successful, OnlineChart will appear as follows at runtime.