This section explains how to integrate widget "OnlineChartHDA".
Graph data
When the graph is initialized, the historical data is displayed followed by the current values of the process variable.
At the set interval (updateBufferTime), historical data is requested from the server and replaces the online data. The graph can become more or less accurate depending on the sampling interval of the binding and history.
If no historical data is available (disabled), only data from the binding is used to draw the graphs. This can be observed if the graph is empty during initialization.
Updating with historical files can be disabled by setting property updateBufferTime to 0.
Displaying multiple process variables
To display multiple process variables, additional graphs and y-axes can be added.
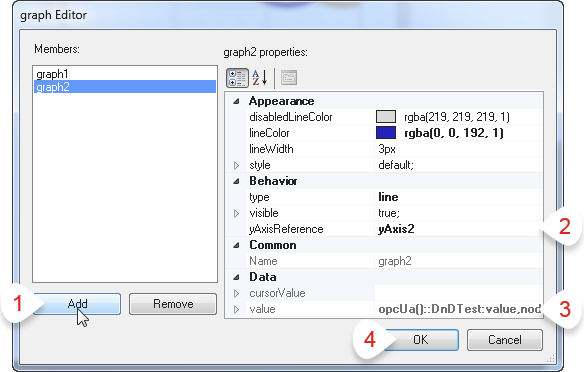
How to add a 2nd graph or 2nd y-axis is explained in the following image.
•Adding a 2nd graph: •Press "Add" to add a 2nd graph. •Enter the name of the associated y-axis. •Add a data binding. •Press "OK". |
|
It is recommended to use a separate y-axis for each process variable. If the desired variables have the same unit, the same y-axis can be used.
Note: A maximum of 8 graphs and 5 y-axes can be configured in widget "OnlineChartHDA".
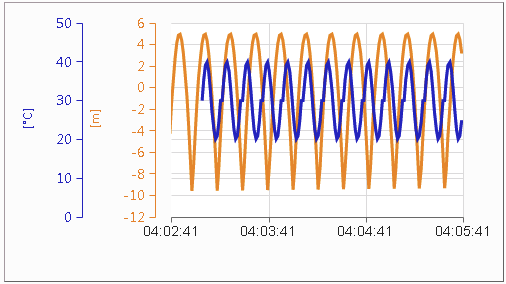
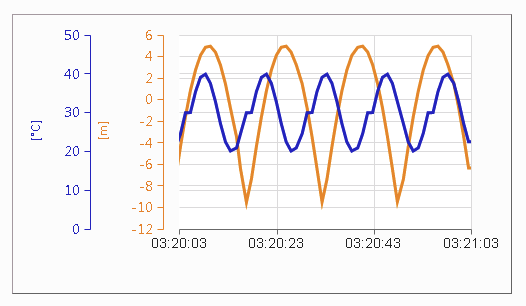
In this image, an "OnlineChartHDA" is displayed with two graphs and two y-axes with different units.
Behavior of the actions
By default, widget "OnlineChartHDA" is always updated with new online data.
In default mode, zoom and scroll actions are disabled.
Some of the actions from widget "OnlineChartHDA" such as "Freeze", "Unfreeze" and "Zoom" are explained in detail in the following:
Freeze
Action Freeze puts the widget into freeze mode. Then no new data is loaded into the widget and the last piece of data loaded is displayed in the graph.
In freeze mode, the graph type (property type of the graph collection) always changes from the set value (e.g. line) to stepLine.
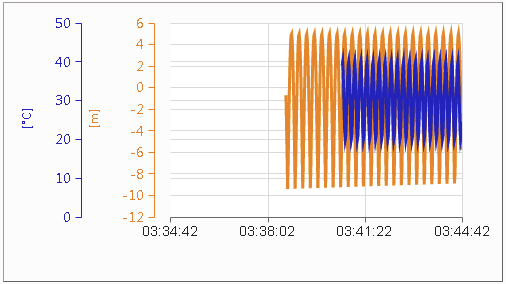
The visible time window in which the data is displayed is defined by timespan on the x-axis collection. The following images show a graph with "timespan" of 3 minute (180 s) and a graph with "timespan" of 1 hour (3600 s).
|
|
timespan = 180 |
timespan = 3600 |
The zoom and scroll actions can be used in freeze mode. When this mode is enabled, a cursor is automatically enabled that can be used for data analysis.
The graph cannot be changed by a list binding in freeze mode. Changing the graph by a list binding in freeze mode could later affect the correct behavior of the widget.
Unfreeze
Action Unfreeze returns widget "OnlineChartHDA" to default mode from freeze mode. The graph is then updated with new online data.
The new data is always loaded into the graph from the right. The visible time window that the data is loaded into can be defined by the user at the x-axis collection using property timeSpan.
In this mode, zoom and scroll actions are disabled.
Zoom
The zoom actions can only be used in freeze mode.
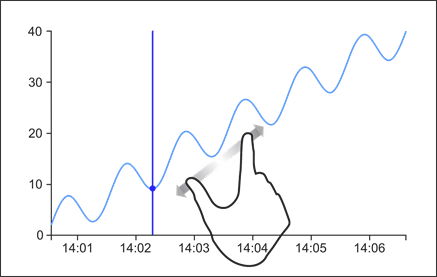
The graph area can be enlarged by marking the desired area. It is also possible to enlarge the graph area with the pinch-to-zoom gesture.
|
|
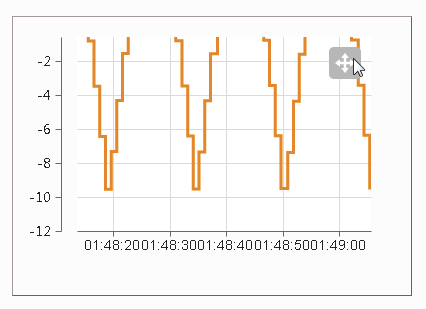
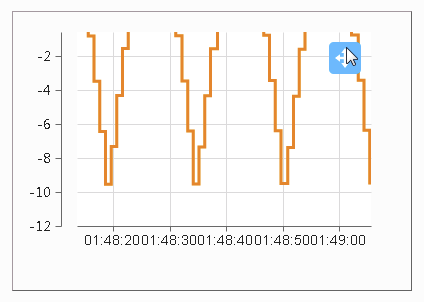
When the selected area has been zoomed in, the graph displays a directional pad button. This button enables the pan mode, which allows panning around the graph.
The following actions are available for zooming with an event binding:
•ZoomIn: Zooms in 20%
•ZoomOut: Zooms out 20%
•ZoomReset: Resets the graph view back to 100%
Pan
When pan mode is enabled, a finger-swipe can be used to move the graph area. This action is only possible in freeze mode.
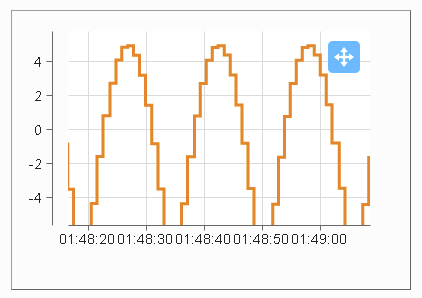
Pan mode is enabled when the graph view is enlarged with the mouse or a touch action. A directional pad button then appears that must be pressed. The directional pad button is colored blue, and then the graph area can be moved using a mouse or finger.
The following shows how to enable pan mode. It is then possible to scroll down, up, left or right anywhere within the graph area:
|
|
|
Scroll
The following actions are available for scrolling with an event binding:
•ScrollUp: Scrolls up 25%
•ScrollDown: Scrolls down 25%
•ScrollLeft: Scrolls 25% to the left
•ScrollRight: Scrolls 25% to the right
When the graph changes to freeze mode, the limits of the x-axis are defined.
Previous data can be displayed with action "ScrollXAxis".
ScrollXAxis
If the diagram is in freeze mode and not zoomed in, the x-axis can be moved using the drag gesture. This means that it is possible to scroll back to the historical data.
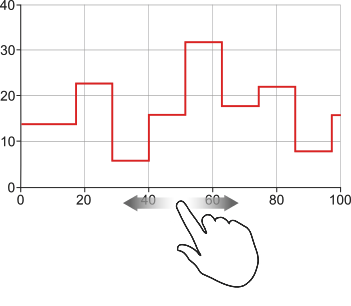
This allows data outside the currently set time span to be analyzed.
The following action is available for scrolling with an event binding:
•ScrollXAxis: Scrolls the x-axis by the specified offset value in seconds.
With a negative number, scrolling to the left to the historical data is possible.
With a positive number, scrolling to the right to the new data up to the freeze time is possible.
Cursor
The cursor can only be used in freeze mode.
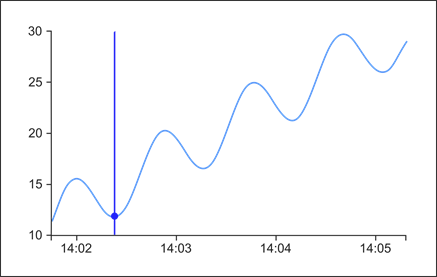
When moving the mouse over the graph, a cross-hair pointer (cursor) is displayed in the graph. On a touch panel, a long touch with the finger must be performed to see the cursor.
Various data points can then be retrieved from the graph using the cursor.
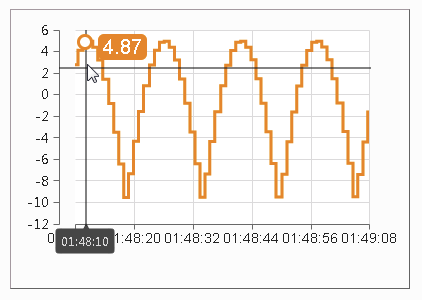
It is also possible to bind the current cursor values to a variable using property cursorValue from the graph collection.
