This section contains more detailed explanations about how to configure widget "OnlineChartHDA".
UTC time difference between the server and client
Widget "OnlineChartHDA" is based on UTC.
This means that when the time information from the data arrives, the widget removes the time zone information and changes it to local time.
Example:
Remote time = UTC + Time zone (remote) = (example) 10:00 AM + 4 = 2:00 PM
Local time = UTC + Time zone (local) = (example) 10:00 AM - 2 = 8:00 AM
The widget receives data in remote time (2:00 PM), removes the time zone information (remote) (+4), works with the time in UTC (10:00) and displays the data in local time (-2) – 8:00 AM in this case.
The warning message regarding the time difference between server and client only affects the UTC time and does not take the time zone into account.
Application example:
If a target system is used as a remote server and a panel as a client, they are not always synchronized with each other.
Remote server time: 10:28:58 AM (with time zone -2) → serverUTC = 12:28:58 AM
Client time: 2:30:15 PM (with time zone +2) → clientUTC = 12:30:15 PM
In this case, the UTC time deviation between server and client is: Absolute value (serverUTC - clientUTC) = | 12:28:58 - 12:30:15 | = 77 s.

If the warning message is closed, OnlineChartHDA data is always displayed in the client's time (local time).
Time configuration:
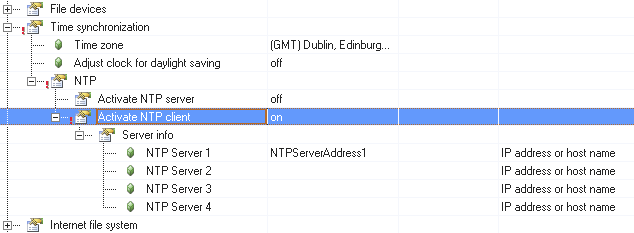
If a B&R target system is used, it is important that the correct UTC time is set.
It is recommended to enable the NTP client in the hardware configuration so that this does not need to always be done manually:

For additional information about NTP settings, see Time synchronization.
Arrangement of y-axes
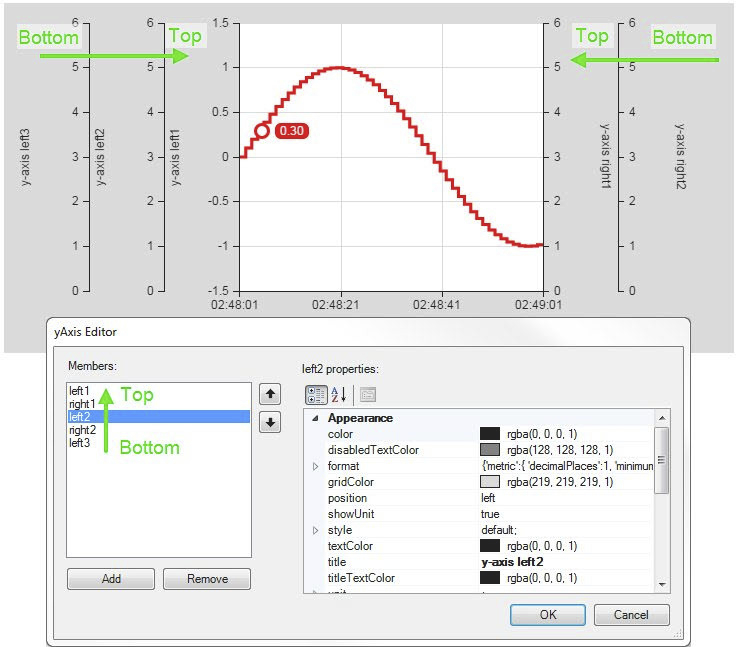
The order of y-axes can be changed in the YAxis editor.
The further up the y-axis is in the list, the closer the y-axis is to the diagram area.

Arrangement of the graph
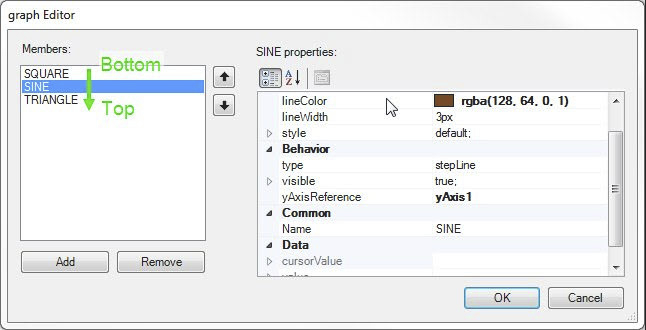
The relative level of each graph can be set in the graph editor.
The lower the graph is in the list, the higher it is in the level.
|
|
|
General conditions
Target system overload
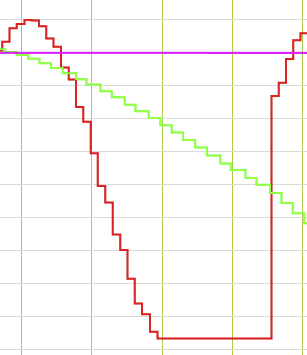
If the target system is overloaded (if too many tasks must be processed) the historical data may be incomplete:

It is important to ensure that the target system is not overloaded.
A task can be moved to another task class, for example.
The graph disappears in freeze mode
When scrolling or changing the time of the x-axis, a graph may disappear.
This is because the historical buffer is a ring buffer. When the buffer is full, old data is removed so that it can no longer be displayed in the graph.
To avoid this problem, a buffer size sufficient for the use case must be selected.

