The following explains how to configure and use widget "OnlineChartHDA".
Enabling function "Historizing"
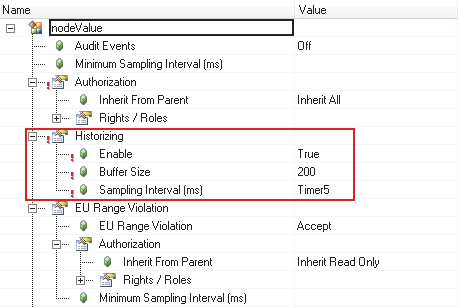
If historical process values are required, "Historizing" (OPC UA HDA Historical Data Access) must first be enabled for the desired variable.
The OPC UA default view file (OpcUaMap.uad) is opened in the Configuration View. When a desired variable is selected, input "Enable" can be set to true under "Historizing".
The buffer size (maximum number of entries of historical data) and the sampling interval (time interval for checking for value changes) are also set.
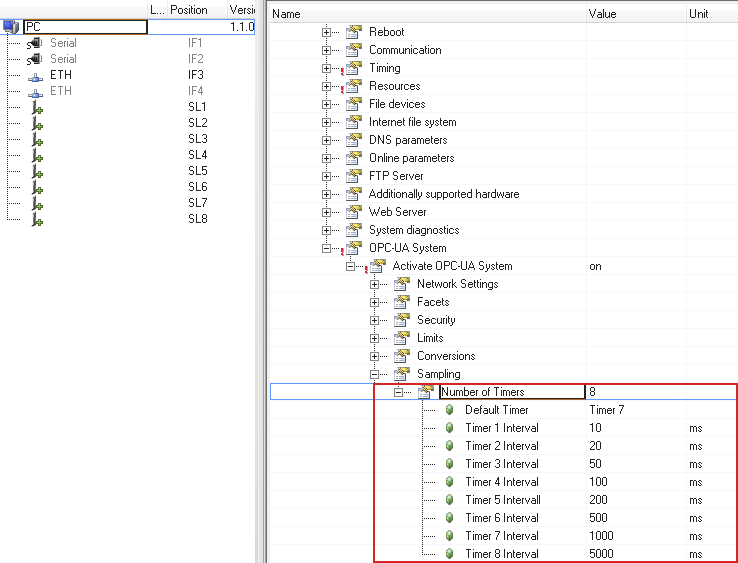
This timers are defined in the target system configuration.
Add widget "OnlineChartHDA"
Widget "OnlineChartHDA" is added in a piece of content:
The widget consists of 4 collections (graph, xAxis, yAxis, cursor), i.e. the x-axis, y-axis, the graph and an optional cursor are all configured directly from widget "OnlineChartHDA".
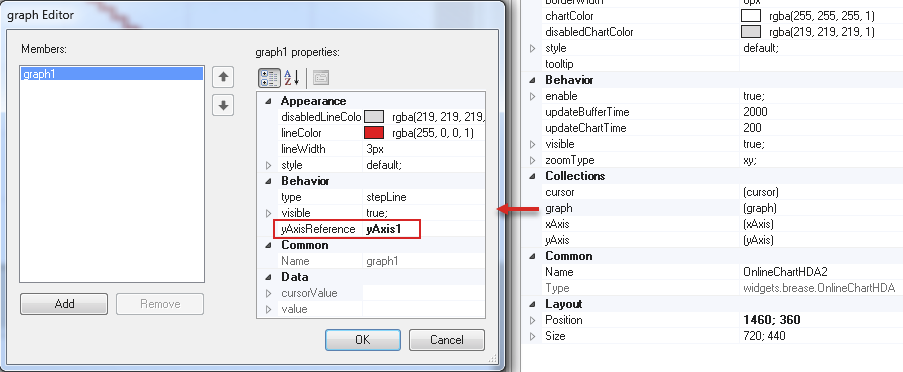
If collection graph is opened, the styleable properties of a graph and the bindable data source are configured in a collection dialog box.
Property yAxisReference must be used to establish the reference to the y-axis. The Name of the y-axis is specified.
Data binding
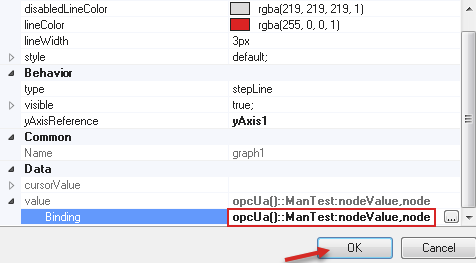
In order to define which variable should be recorded a binding must be created in the collection dialog box of the graph.
On property value, the desired variable is selected; function "Historizing" function is enabled and then confirmed with OK.
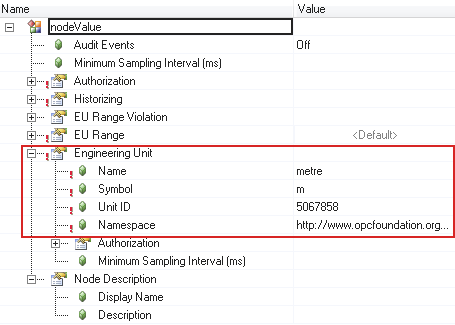
If displaying a unit at the y-axis is desired, the unit must be added to the variable in the OPC UA DefaultView file (OpcUaMap.uad).
Browser
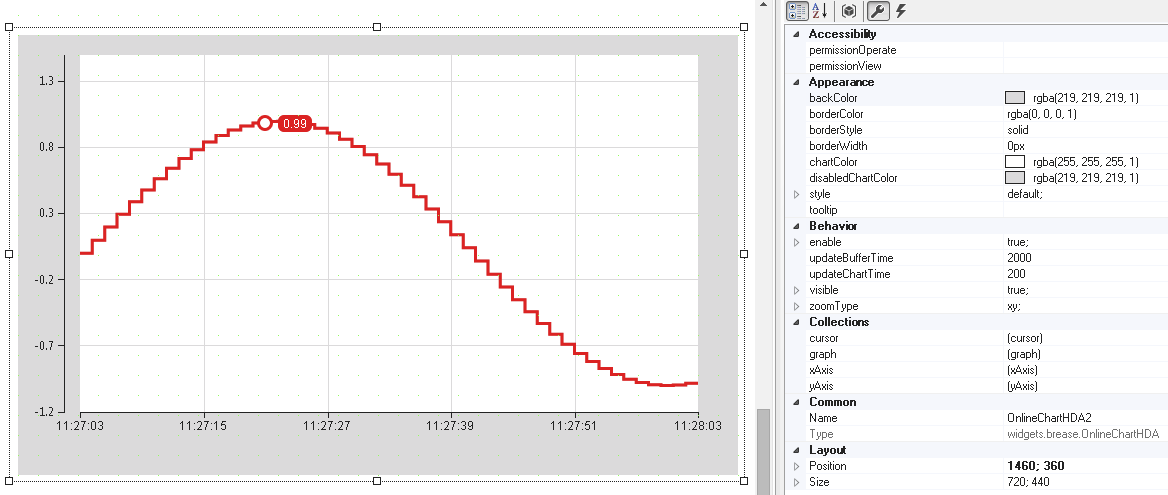
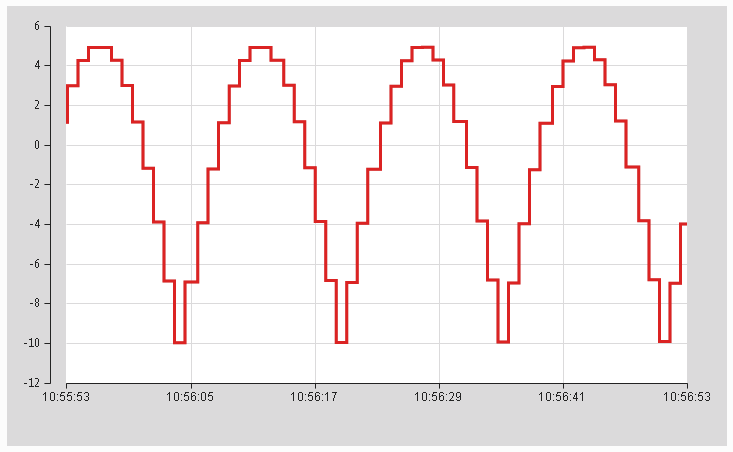
Widget "OnlineChartHDA" can look like this when bound to the HMI application:
For an explanation of how to interact with widget "OnlineChartHDA", see here.
