This section explains how to interact with widget XYChart.
Graph data
The graph data is updated according to updateChartTime.
The value pair of the arrays must have the same length. There is no technical limitation to the expected length.
Updating with the files can be disabled by setting property updateChartTime to 0.
Displaying multiple process variables
Additional graphs, x-axes and y-axes can be added to display multiple process variables.
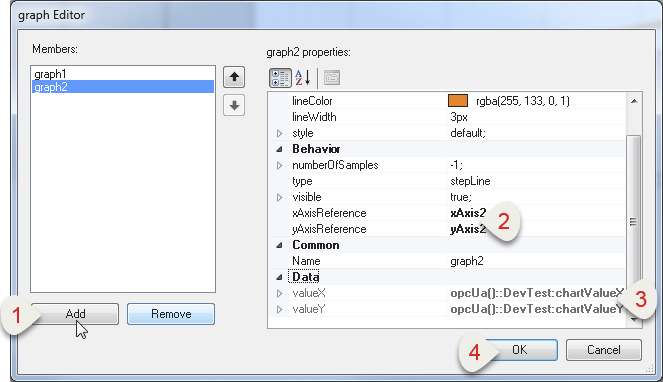
How to add a 2nd graph or 2nd y-axis is explained in the following image.
•Adding a 2nd graph: •Press "Add" to add a 2nd graph. •Enter the name of the associated y-axis and x-axis. •Add the data bindings. •Press "OK". |
|
Note: A maximum of 16 graphs, 8 x-axes and 8 y-axes can be configured in widget XYChart.
Since more than one graph can be referenced to the same axes (unit of the OPC UA variables must match), the user can define a manual range for each axis.
If automatic scaling (autoscale) is configured, the highest maximum or lowest minimum value of the bound variables is used.
Behavior of the actions
The data is displayed as a collection of points by default, where each point has the value of a variable that determines the position on the horizontal axis and the value of the other variable that determines the position on the vertical axis.
In default mode, zoom and scroll actions are disabled.
Some of the actions from widget XYChart such as "Freeze", "Unfreeze" and "Zoom" are explained in detail in the following:
Freeze
Action Freeze puts the widget into freeze mode. Then no new data is loaded into the widget and the last piece of data loaded is displayed in the graph.
Action Update can be used to update the data in freeze mode.
The zoom and scroll actions can be used in freeze mode. When this mode is enabled, a cursor is automatically enabled that can be used for data analysis.
Unfreeze
Action Unfreeze can be used to change widget XYChart from freeze mode back to the default mode. The graph is then updated with the current data.
In this mode, zoom and scroll actions are disabled.
Zoom
The zoom actions can only be used in freeze mode.
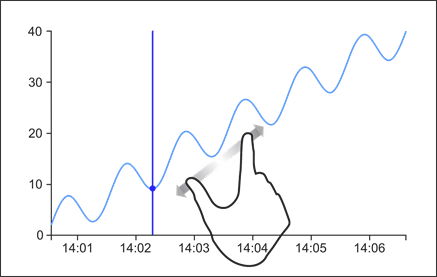
The graph area can be enlarged by using the mouse wheel. It is also possible to enlarge the graph area with the pinch-to-zoom gesture.
|
|
The following actions are available for zooming with an event binding:
•ZoomIn: Increases the current zoom factor by 20%
•ZoomOut: Decreases the current zoom factor by 20%
•ZoomReset: Resets the graph view back to 100%
The following example shows that action ZoomIn never reaches 100% of the diagram view completely by action ZoomOut since the starting point is always different.
If action ZoomIn and action ZoomOut are triggered once in succession, this results in the following zoom factor:
Current zoom factor = 1
1st ZoomIn action → Current zoom factor = Current zoom factor * 1.2 = 1 * 1.2 = 1.2
1st ZoomOut action → Current zoom factor = Current zoom factor / 0.8 = 1.2 * 0.8 = 0.96
Scroll
If a selected graph area has been enlarged, the scroll actions can be used. This way, the graph view can be changed.
The following actions are available for scrolling with an event binding:
•ScrollUp: Scrolls up 25%
•ScrollDown: Scrolls down 25%
•ScrollLeft: Scrolls 25% to the left
•ScrollRight: Scrolls 25% to the right
Cursor
The cursor can only be used in freeze mode.
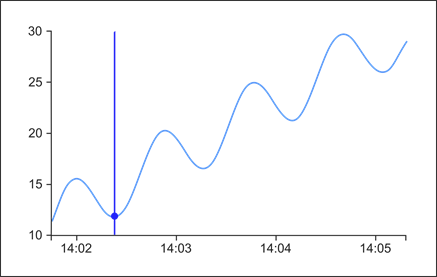
When switching to freeze mode, a circular cursor is displayed for each graph.
By clicking on the graph, the cursor moves to this click position and these data points can be taken from the diagram.
To get the current cursor values, properties cursor1XValue and cursor1YValue from the graph collection can be bound to two variables.


